> ## Documentation Index
> Fetch the complete documentation index at: https://docs.tess.im/llms.txt
> Use this file to discover all available pages before exploring further.
# Deep Analysis
LLMs are excellent at interpreting text, writing, summarizing, and generating content. But when it comes to calculations, statistics, and data analysis, any model will have an uncomfortable margin of error — which, for sensitive professional tasks, is unacceptable. For financial reports, sales spreadsheets, and business decisions, you need absolute precision.
That is exactly what Deep Analysis is for: a tool that combines LLM natural language conversation with the accuracy of traditional computing.
### **What is Deep Analysis?**
Deep Analysis is a secure and isolated environment (a "sandbox") where, instead of the AI trying to do the math "in its head", it:
1. understands what you want to do with the data
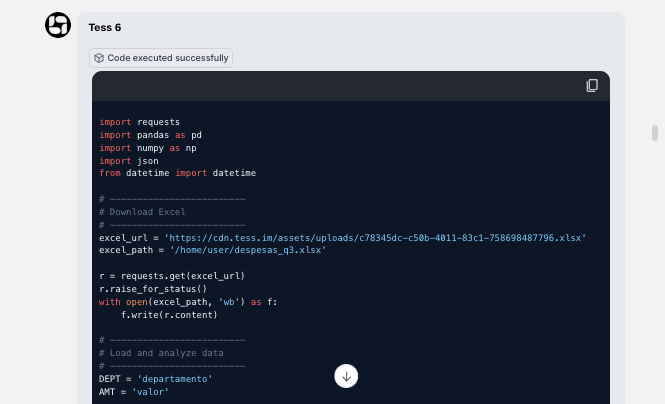
2. writes Python code to execute that task
3. runs that code in the sandbox
4. returns the result with 100% mathematically correct calculations
In other words: you talk in natural language; Tess creates a virtual machine, translates it into code, executes it, and delivers the ready result (tables, metrics, charts, segmentations, etc.).
### **How to use Deep Analysis in the chat**
Whenever you need any quantitative or qualitative/quantitative analysis, a report, HTML, or similar processing, activate the Deep Analysis tool in the chat!
If you have a base document, remember to send your file, make your request in natural language, and mention the file and what needs to be done with it.
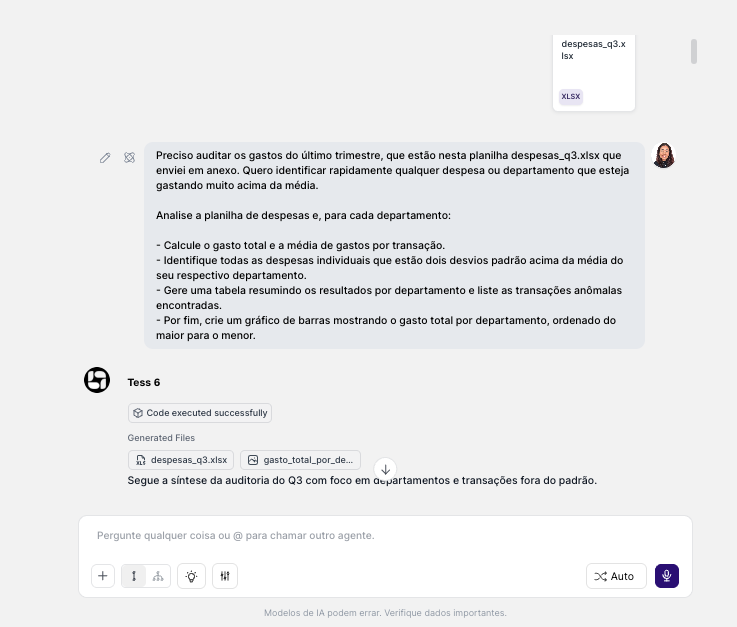 You can also use Deep Analysis to work on interactive reports or dashboards in HTML format:
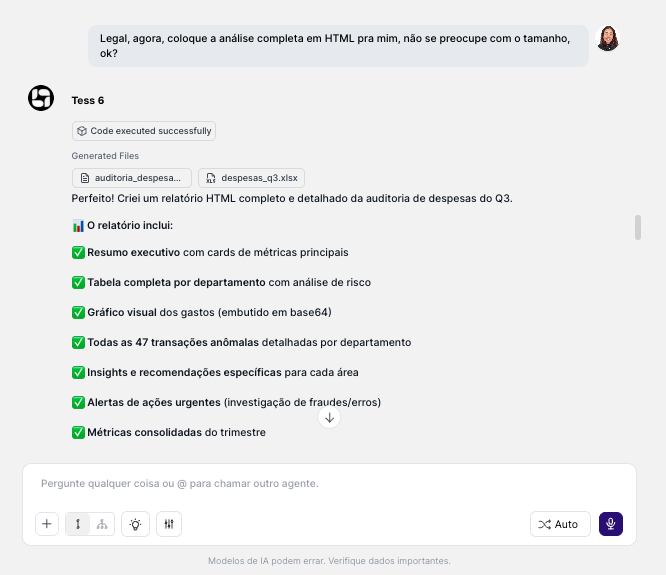
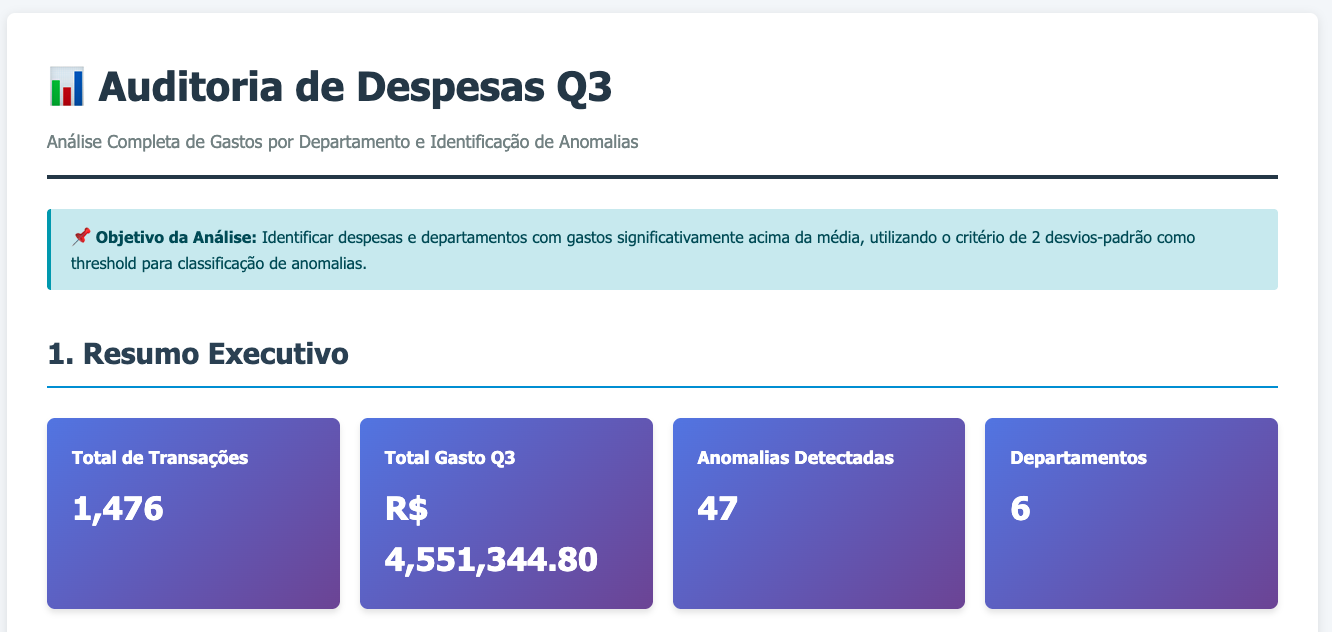 **Access the HTML Report** ([link](https://tess-workflows-files.storage.googleapis.com/6ca511cbbab87f2226b638f5d69a04e7316b6e8d/auditoria_despesas_q3_completa.html))
The same applies to Dashboards:
**Access the HTML Report** ([link](https://tess-workflows-files.storage.googleapis.com/6ca511cbbab87f2226b638f5d69a04e7316b6e8d/auditoria_despesas_q3_completa.html))
The same applies to Dashboards:
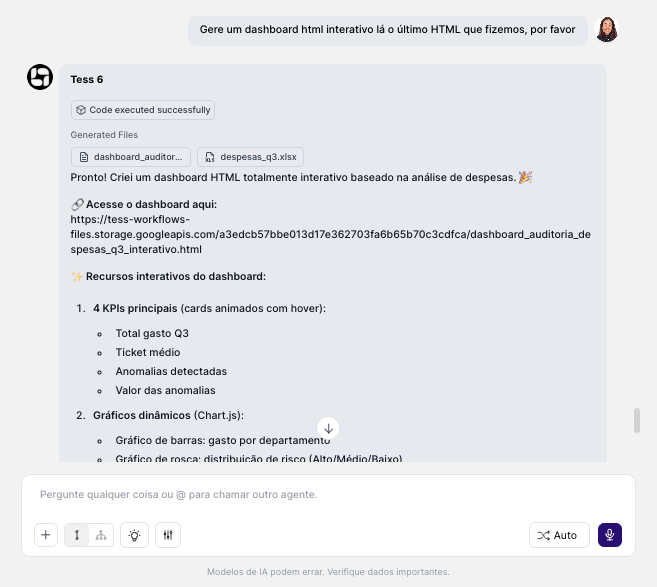
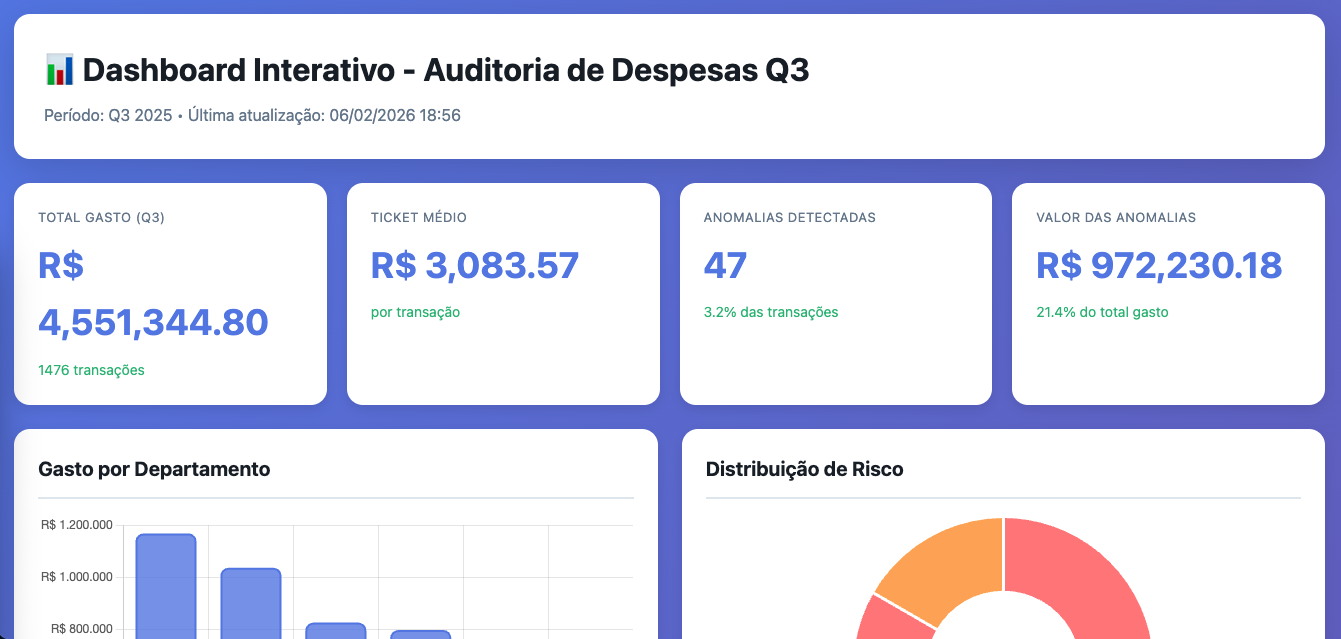 **Access the HTML Dashboard** ([link](https://tess-workflows-files.storage.googleapis.com/a3edcb57bbe013d17e362703fa6b65b70c3cdfca/dashboard_auditoria_despesas_q3_interativo.html))
For Dashboards, since the view is built with static data, there is no automatic HTML update — therefore, any change requires the HTML to be regenerated.
### Use it whenever data accuracy is the top priority, for example:
Financial, sales, and customer analyses; period comparisons (month over month, year over year), etc.
Calculate EBITDA, profit margin, average ticket; perform statistical analyses (averages, medians, standard deviation, etc.).
Data visualization, bar charts, line charts, pie charts, scatter plots, etc.; visualize sales trends, churn, engagement, costs.
Process experimental data; execute complex formulas; engineering, science, and experiments, etc.
Identify best-selling products; segment customers by value range or purchase frequency, etc.
Evaluate campaign or channel performance; project scenarios and strategies based on historical data, etc.
### **Common supported formats**
* Spreadsheets (XLSX)
* CSV files
* Other structured formats that can be read via Python (when applicable)
Prompt examples: 1. "Analyze this file vendas\_trimestre.xlsx, calculate the total sales for each product category, and create a pie chart showing each one's share." 2. "In this customer CSV, calculate the average ticket by region and display it in a table sorted from highest to lowest." 3. "Generate a line chart showing the monthly revenue trend over the last 12 months."
Beyond that, the more literal and detailed your prompt, the better the AI's understanding and performance in this case. Tools of this type tend to respond well to objective and precise commands.
In this process, Tess will write the code, execute it in the sandbox, and return the results (tables, explanations, and, when requested, charts generated from the data).
**Access the HTML Dashboard** ([link](https://tess-workflows-files.storage.googleapis.com/a3edcb57bbe013d17e362703fa6b65b70c3cdfca/dashboard_auditoria_despesas_q3_interativo.html))
For Dashboards, since the view is built with static data, there is no automatic HTML update — therefore, any change requires the HTML to be regenerated.
### Use it whenever data accuracy is the top priority, for example:
Financial, sales, and customer analyses; period comparisons (month over month, year over year), etc.
Calculate EBITDA, profit margin, average ticket; perform statistical analyses (averages, medians, standard deviation, etc.).
Data visualization, bar charts, line charts, pie charts, scatter plots, etc.; visualize sales trends, churn, engagement, costs.
Process experimental data; execute complex formulas; engineering, science, and experiments, etc.
Identify best-selling products; segment customers by value range or purchase frequency, etc.
Evaluate campaign or channel performance; project scenarios and strategies based on historical data, etc.
### **Common supported formats**
* Spreadsheets (XLSX)
* CSV files
* Other structured formats that can be read via Python (when applicable)
Prompt examples: 1. "Analyze this file vendas\_trimestre.xlsx, calculate the total sales for each product category, and create a pie chart showing each one's share." 2. "In this customer CSV, calculate the average ticket by region and display it in a table sorted from highest to lowest." 3. "Generate a line chart showing the monthly revenue trend over the last 12 months."
Beyond that, the more literal and detailed your prompt, the better the AI's understanding and performance in this case. Tools of this type tend to respond well to objective and precise commands.
In this process, Tess will write the code, execute it in the sandbox, and return the results (tables, explanations, and, when requested, charts generated from the data).
 Deep Analysis is the bridge between natural language conversation and the rigor of data science. It ensures that reports, analyses, and charts generated by Tess AI are not just intelligent — but mathematically correct.