> ## Documentation Index
> Fetch the complete documentation index at: https://docs.tess.im/llms.txt
> Use this file to discover all available pages before exploring further.
# Usage Monitoring
Having complete visibility over how the members of your Workspace use Tess AI can be essential for security, governance, cost control, and the optimization of your processes.
For families, Usage control enables Parental Control, meaning parents who are the Owners of Workspaces can closely monitor how their children are using AI. On the other hand, managers can track the engagement and evolution of their team members.
The "Usage" screen was created exactly for these situations, offering a detailed history of interactions with AI in your workspace.
### **How to access the Usage screen**
The screen presents a complete record of every time an AI model was triggered. You can filter and analyze this information to gain valuable insights.
### **Using the Filters**
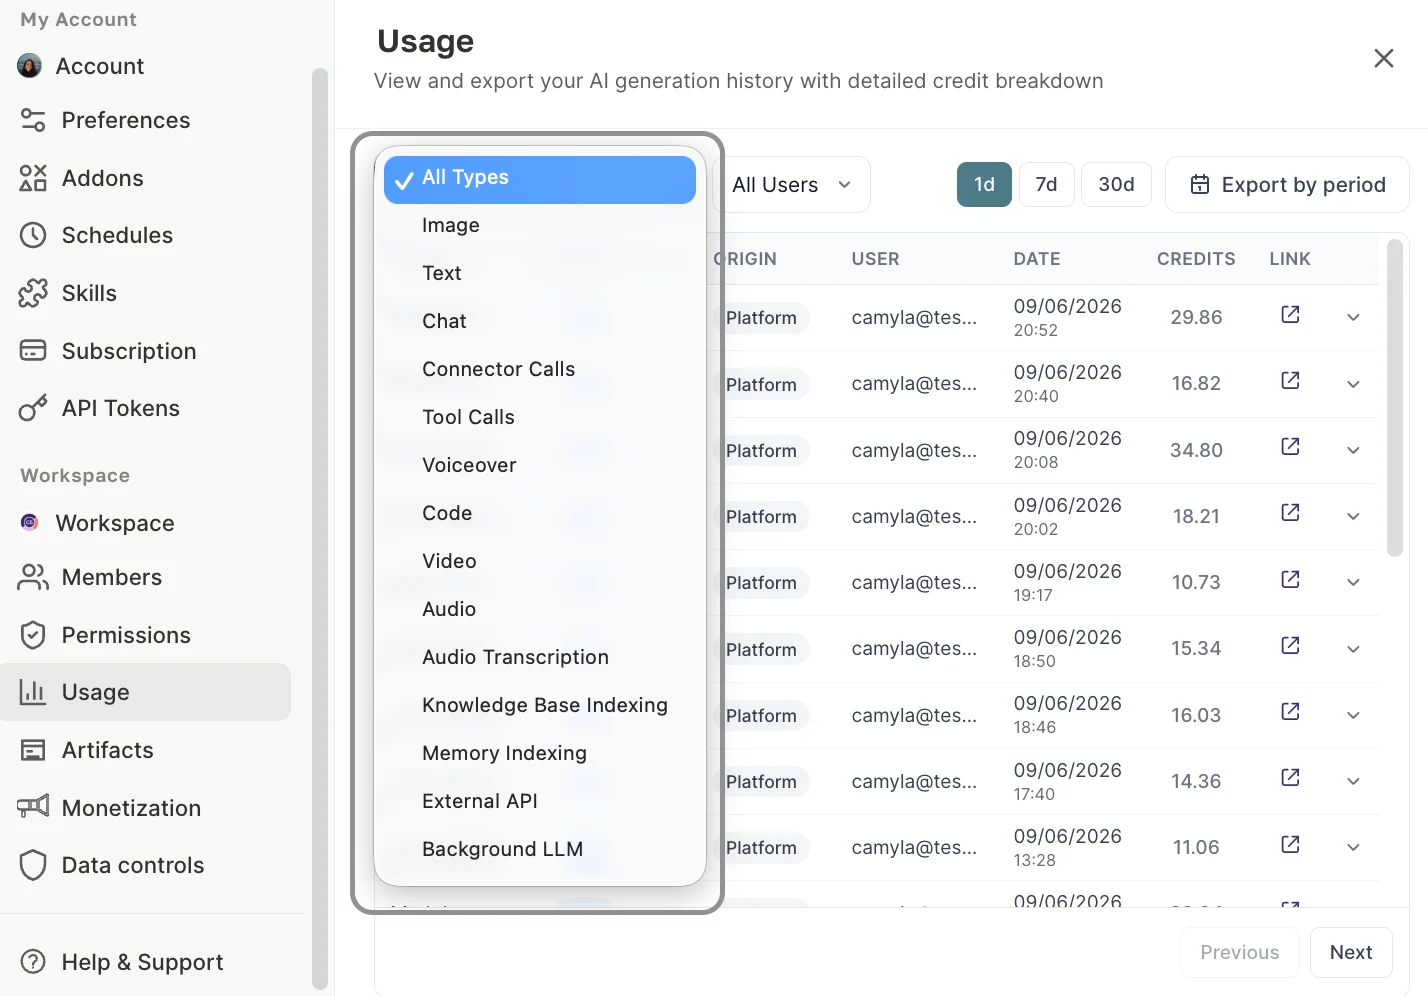
At the top of the screen, you will find filters to refine your search:
1. **Type:** Allows you to filter by type of interaction, such as chat, Images, Codes, among others.\\
 2. **User**: Select a specific member of the Workspace to view only their activities.
3. **Period**: Choose a time range for the analysis, with quick options for the last 1, 7, or 30 days.
**Note**
*When exporting CSV, it is possible to customize the analysis period, expanding or specifying ranges different from the previous options.*
### **Understanding the table data**
Each row in the table represents a single AI execution and is detailed in the following columns:
The name of the AI Agent that was used in the interaction or Tess Standard Chat (identified as Tess 6).
The type of execution (e.g.: Chat, Video, Image, etc).
From where the call was made. It will generally be "Platform" (indicating direct use within Tess) or "API" (if the call came from an external system).
The email of the team member who performed the action.
The exact day and time when the interaction occurred.
The amount of credits that was consumed by that specific interaction. This column is fundamental for tracking costs.
A shortcut that takes you directly to the conversation or the record of that specific interaction, allowing for a quick and contextualized audit. Here, Owners and Managers will be able to access the logs of conversations and executions.
### **Exporting Data for Analysis**
For deeper analysis, creation of custom reports, or long-term storage, you can export the data.
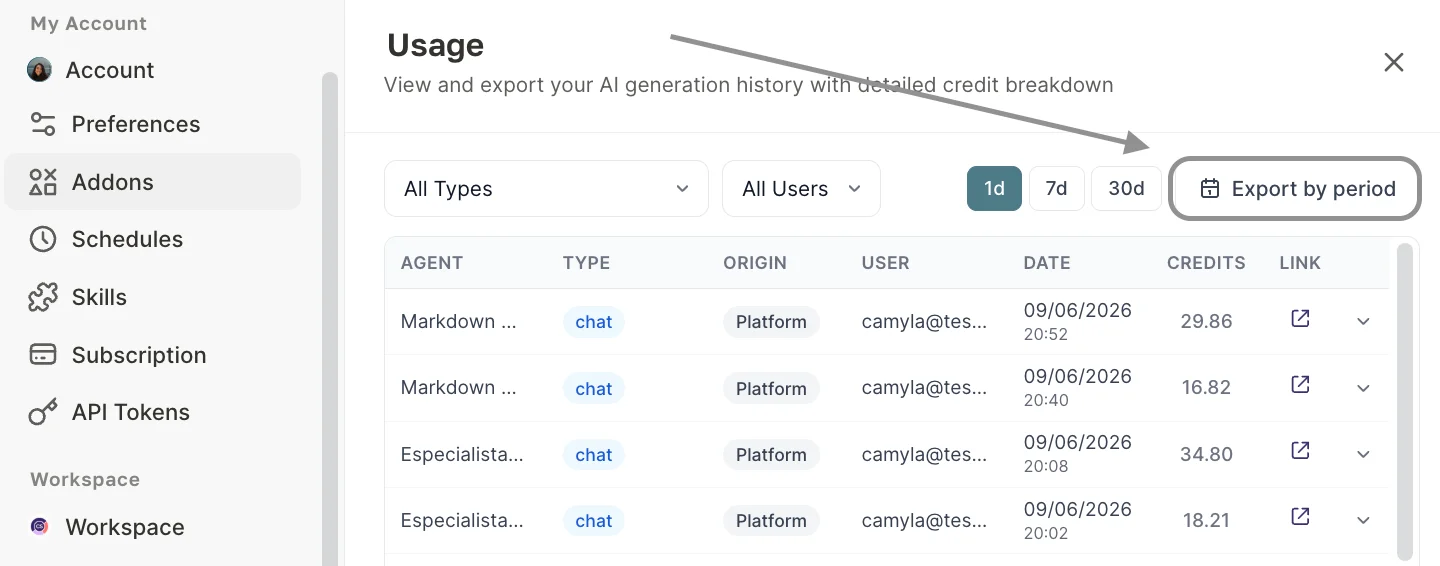
Click the "Export CSV" button in the upper right corner. This will download a file in CSV format (compatible with Excel, Google Sheets, and other spreadsheet tools) containing all the data that matches the filters selected at the time of export.
2. **User**: Select a specific member of the Workspace to view only their activities.
3. **Period**: Choose a time range for the analysis, with quick options for the last 1, 7, or 30 days.
**Note**
*When exporting CSV, it is possible to customize the analysis period, expanding or specifying ranges different from the previous options.*
### **Understanding the table data**
Each row in the table represents a single AI execution and is detailed in the following columns:
The name of the AI Agent that was used in the interaction or Tess Standard Chat (identified as Tess 6).
The type of execution (e.g.: Chat, Video, Image, etc).
From where the call was made. It will generally be "Platform" (indicating direct use within Tess) or "API" (if the call came from an external system).
The email of the team member who performed the action.
The exact day and time when the interaction occurred.
The amount of credits that was consumed by that specific interaction. This column is fundamental for tracking costs.
A shortcut that takes you directly to the conversation or the record of that specific interaction, allowing for a quick and contextualized audit. Here, Owners and Managers will be able to access the logs of conversations and executions.
### **Exporting Data for Analysis**
For deeper analysis, creation of custom reports, or long-term storage, you can export the data.
Click the "Export CSV" button in the upper right corner. This will download a file in CSV format (compatible with Excel, Google Sheets, and other spreadsheet tools) containing all the data that matches the filters selected at the time of export.
 Next, select the period for which you want to pull the data:
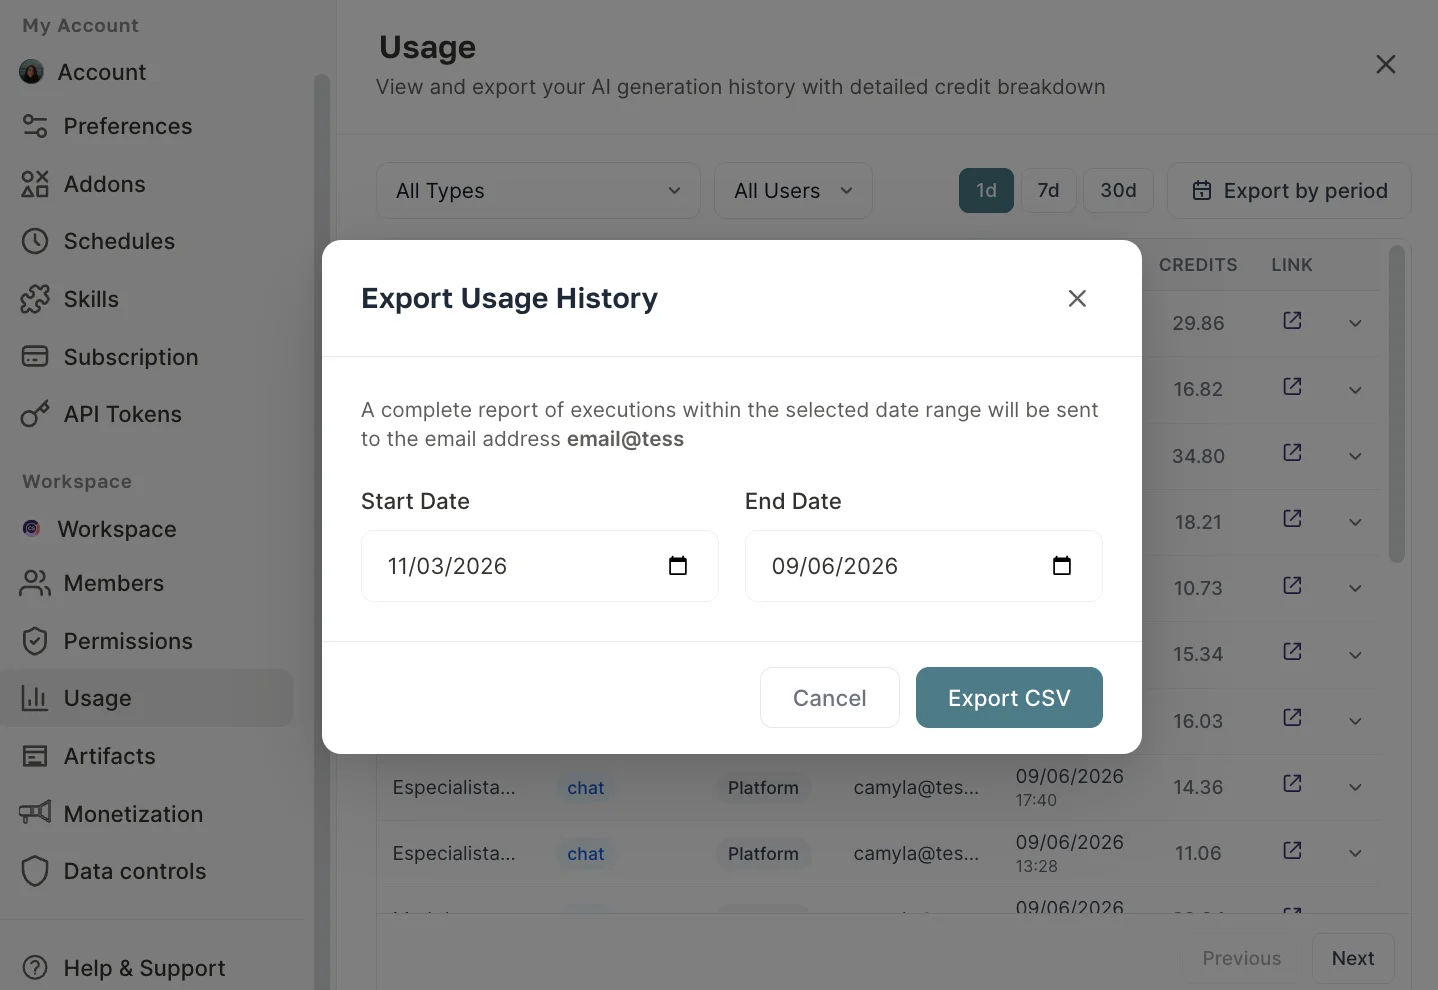 Immediately after, upon exporting the CSV, the document will be sent to your email.
### **Why is this screen important?**
Monitor the use by your children or your team, in order to prevent incompatible or dangerous use.
Monitor exactly which interactions and users are consuming the most credits.
Keep a clear record of all activities performed, ensuring security and compliance.
Identify which agents are the most popular and which team members are using the platform the most.
### Usage history and audit
Besides conversations, the history also works as a control tool:
Administrators can view:
* Executions coming from Public Links
* Executions via Embed
* Interactions made by anonymous users
With this, it is possible to understand the real usage of public content, monitor external access, and, naturally, have more transparency over credit consumption.
These executions appear with a clear source identification such as:
* "Anonymous user (Public Link)"
* "Anonymous user (Embed)"
Immediately after, upon exporting the CSV, the document will be sent to your email.
### **Why is this screen important?**
Monitor the use by your children or your team, in order to prevent incompatible or dangerous use.
Monitor exactly which interactions and users are consuming the most credits.
Keep a clear record of all activities performed, ensuring security and compliance.
Identify which agents are the most popular and which team members are using the platform the most.
### Usage history and audit
Besides conversations, the history also works as a control tool:
Administrators can view:
* Executions coming from Public Links
* Executions via Embed
* Interactions made by anonymous users
With this, it is possible to understand the real usage of public content, monitor external access, and, naturally, have more transparency over credit consumption.
These executions appear with a clear source identification such as:
* "Anonymous user (Public Link)"
* "Anonymous user (Embed)"